The visual format of an element in the PMWeb Gantt chart signifies the type and/or status of the element. It is important to understand what each format means in order to correctly interpret the schedule.
Task Bars
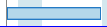
- A task not on the critical path which is 0% complete
- A task not on the critical path which is 30% complete
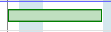
- A task which is 100% complete

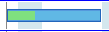
- A task on the critical path which is 0% complete

- A task on the critical path which is 80% complete

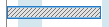
- A locked task. Notice the heavy left and right edge borders.
- A disabled task. External tasks - those from other schedules - are always disabled.
Milestones
A milestone has a date but no duration. Milestones can be created two ways:
-
By right clicking on the Gantt chart and adding a milestone to an existing task line. Milestones created using this method are referred to as "regular" milestones. One task line can contain many regular milestones. When you save the Gantt chart a flag is automatically added to each regular milestone. Regular milestones can be dragged left or right in the chart to change their date but they cannot have or be dependencies. Regular milestones have no effect on schedule calculations.
-
By changing the duration of a task line to "0". These are referred to as "task" milestones.

- A regular milestone

- A regular ending milestone

- A task milestone

- A task ending milestone
Dependency Connectors
This is a Start-To-Start(SS) dependency:
The arrowhead indicates that it is a successor for Task 1 and a predecessor for Task 2
This is a Start-To-Finish(SF) dependency:
The arrowhead indicates that it is a successor for Task 1 and a predecessor for Task 2
This is a Finish-To-Start(FS) dependency:
The arrowhead indicates that it is a successor for Task 1 and a predecessor for Task 2
This is a Finish-To-Finish(FF) dependency:
The arrowhead indicates that it is a successor for Task 1 and a predecessor for Task 2
Red dependency connectors indicate that the schedule needs to be recalculated:
The dashed line segment of a connector indicates a lag, in this example a lag of +2 days:
In this example the lag is -2 days:
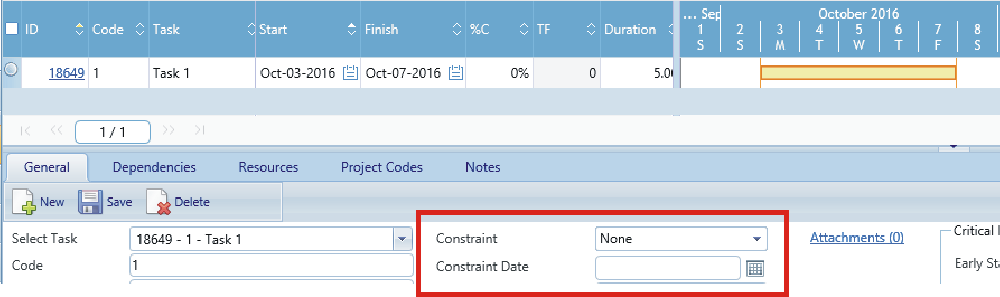
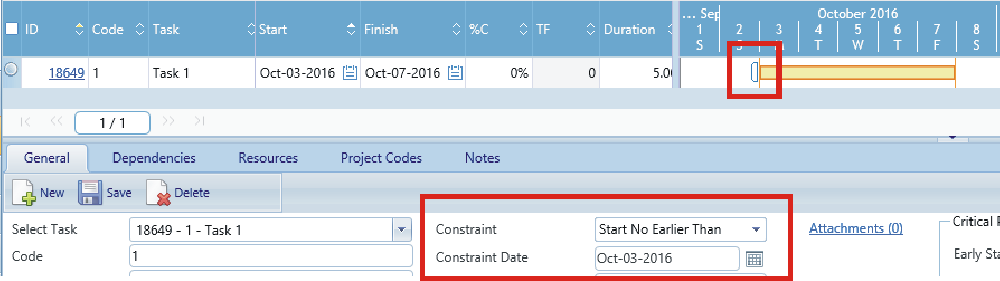
Constraints
This example shows a task with no constraints:
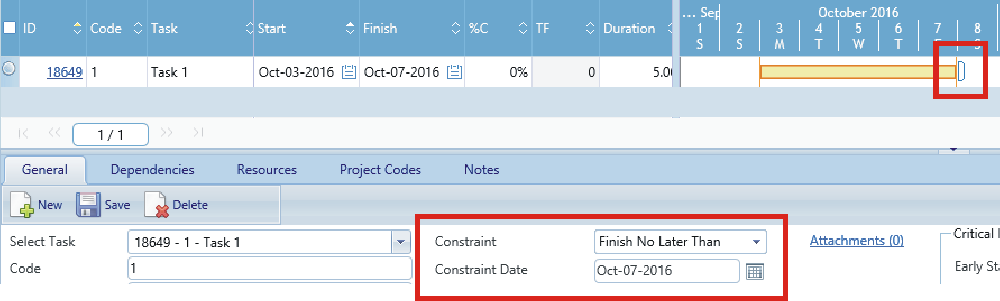
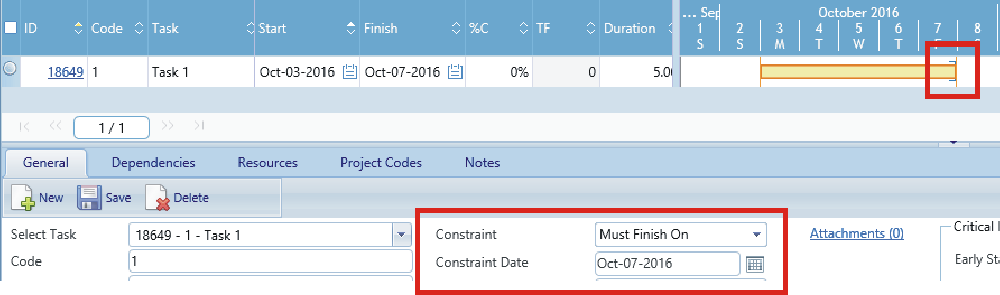
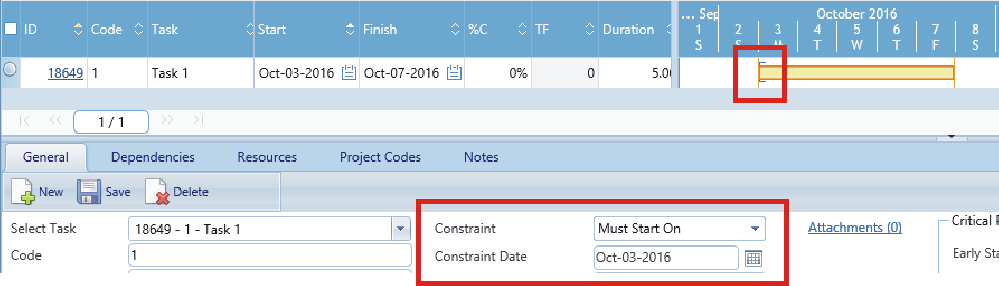
The following screen shots show various constraints and their constraint dates. Notice how each constraint is displayed in the Gantt chart: