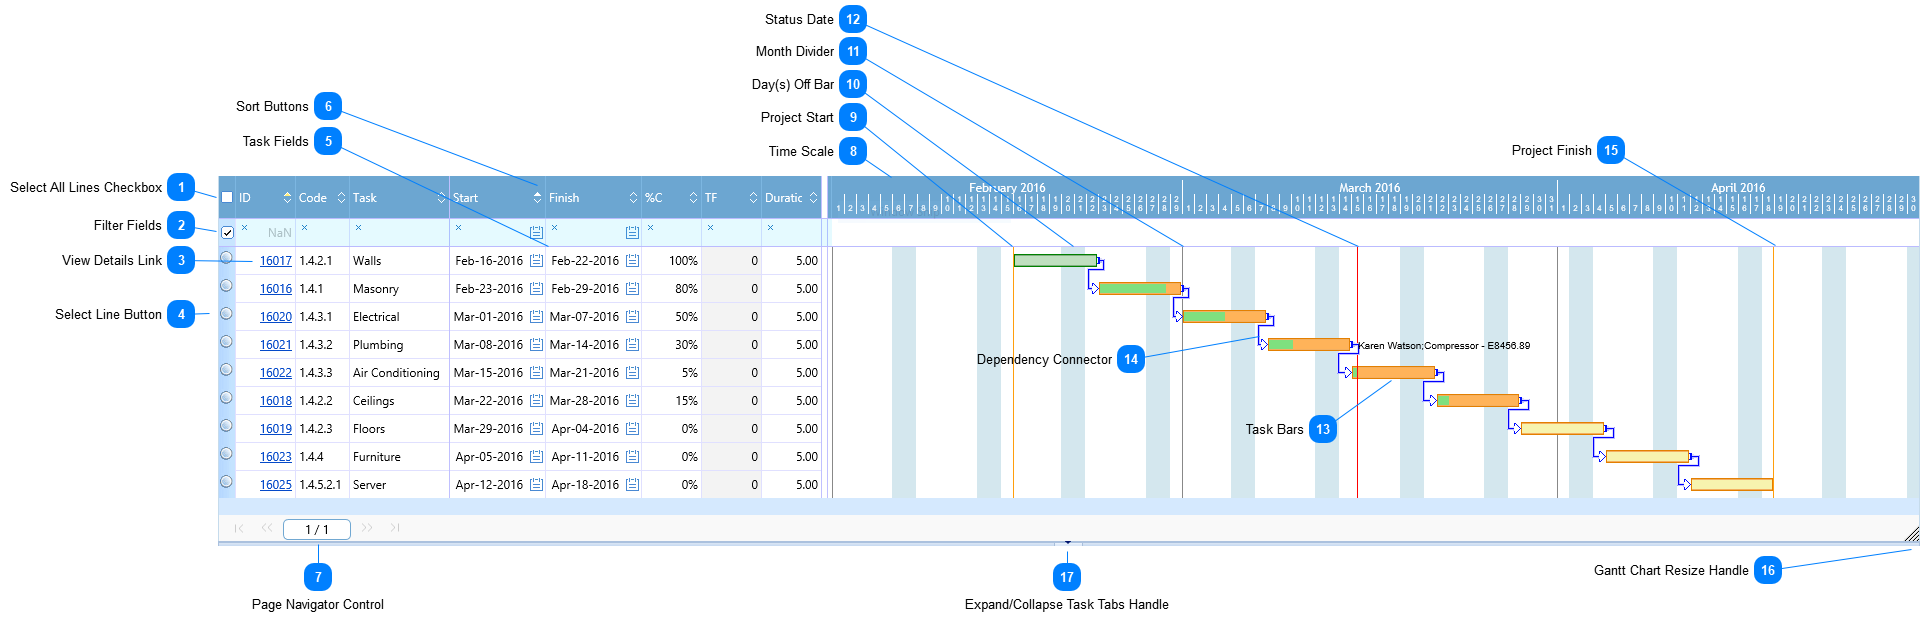
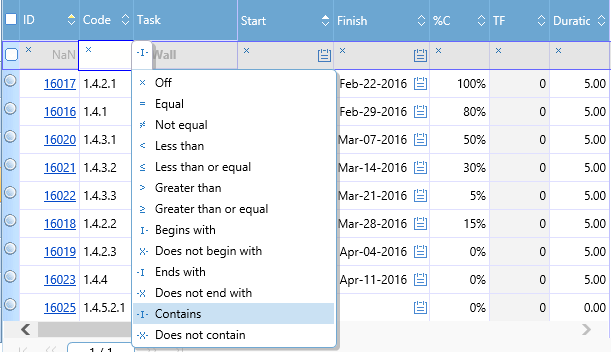
Use these fields to filter tasks that show in the Gantt control. To create a filer click in one of the filter fields and type or select an entry. You can click the small symbol in the upper left of the filter field to select the filter parameter (if you want to use something other than the default parameter.) You can also use the parameter list to toggle a single filter off by selecting the choice in the list: "x Off".
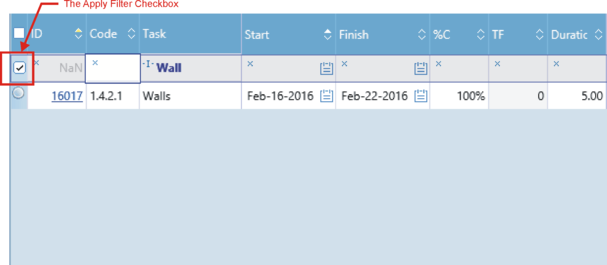
You can create filters in several columns at once if you wish. To apply the filters, place a check in the Apply Filter checkbox. Uncheck the Apply Filter box to remove the filters without clearing the filter fields.
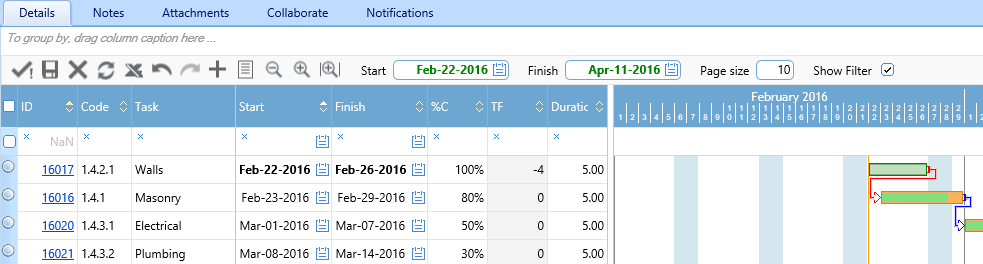
To view and edit the details of a task, click the View Details Link. If you left click the link, and if the Display Task Tabs button is toggled on, the task details display in the tabs below the Gantt chart. (See Schedules Header Toolbar for details about the Display Task Tabs button.) If you right click the link the Task Details dialog opens.
Certain buttons in the Gantt chart toolbar - the Add Task and Delete Task buttons, for example - function differently when lines are selected using the Select Line button. Click the button on one or more lines to select them. Click again to deselect a line.
To select ALL tasks in the current display place a check in the Select All Lines checkbox (see above).
The fields that are displayed for each task are set using the Show/Hide Columns button in the Schedules Gantt Chart Toolbar. Some fields that appear here are also displayed in the Task Details tabs and in the Task Details dialog. Edits to a field in any of these views are also reflected in the other views. See Schedules Task Fields for information about individual fields.
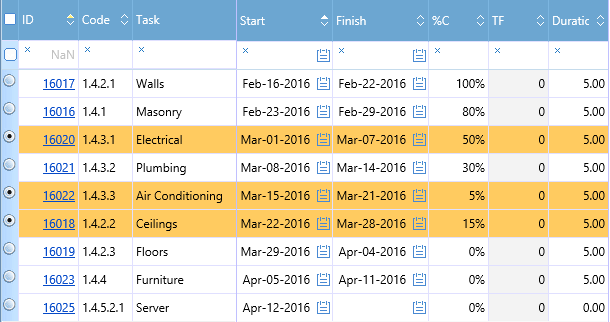
Start and Finish dates that changed as a result of editing or calculation are highlighted in bold text:
The bold formatting is automatically removed after the schedule is saved.
This control allows you to directly scroll to a location in the task list. The number of lines scrolled is determined by the entry in the Page size field in the Schedules Gantt Chart Toolbar. Use the |< and >| buttons to scroll the first and last task pages, respectively, and the << and >> buttons to scroll one page back or forward. You can also click in the field and type the number of the page you wish to scroll to. The buttons will be disabled if there are not enough tasks in the current view to require scrolling.
You can left or right click on the time scale to zoom in or out. See Schedules Gantt Chart Toolbar for information about using the Zoom buttons to change the time scale.
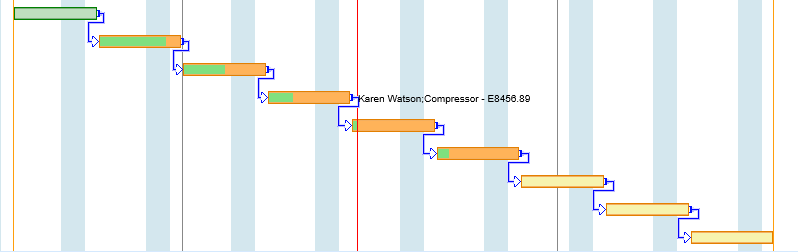
This vertical light blue bar marks days off as defined in the calendar linked to the schedule. See Calendars and Schedules Header Fields for information about calendars.
Each bar represents the duration of a task. The left edge of the bar represents the Start date and the right edge represents the Finish. The position and length of each bar is determined by entering data in the Gantt chart table, in the Task Details tabs, or the Task Details dialog, or by dragging and dropping in the Gantt chart itself. (See Interacting with the Gantt Chart for more information.)
The color format of the bar varies depending on the task's status. (See Reading the Gantt Chart for more information.)
Each connector represents a dependency relationship to another task. (See Schedules Task Details Dependencies Tab for information about dependencies.) The type and format of the connector is determined by entering data in the Gantt chart table, in the Task Details tabs, or in the Task Details dialog, or by dragging and dropping in the Gantt chart itself. (See Interacting with the Gantt Chart for more information.)
Click this handle to collapse or expand the Task Details tabs. This handle only appears if the Display Task Tabs button in the Schedules Header Toolbar is toggled on.