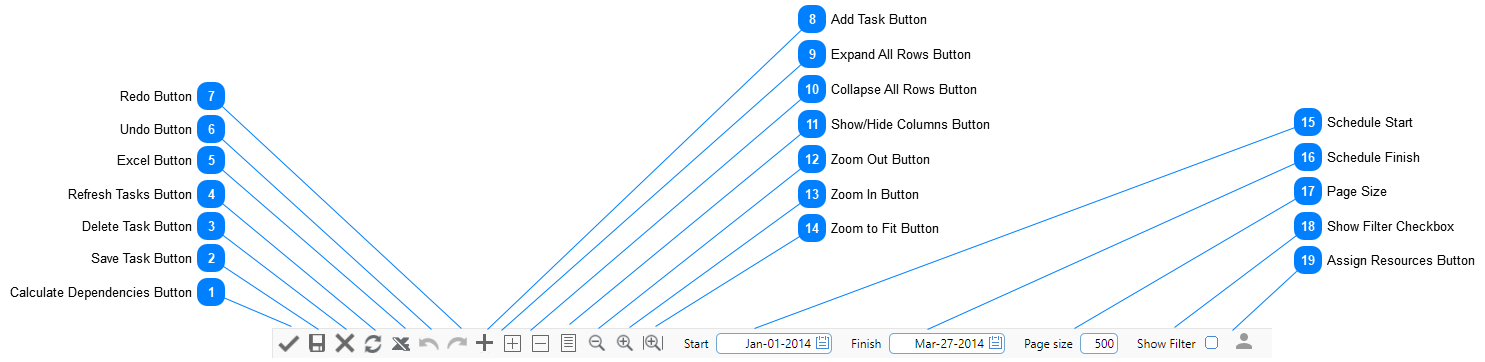
Click this button to recalculate schedule tasks. If edits to any tasks require recalculation an exclamation mark appears next to the Calculate Dependencies button: Note that this button will never need to be clicked if "Auto" is selected in the Schedule Tasks dropdown in the header of the schedule. See Schedules Header Fields for more information.
Click this button to save edits to schedule tasks. It is important to note that saving edits does not recalculate tasks if "Manually" is selected in the Schedule Tasks dropdown in the header of the schedule. See Schedules Header Fields for more information.
Deletes selected lines. Note that any unsaved edits will be lost. It is best practice to click the Save Task button before using the Delete Task button.
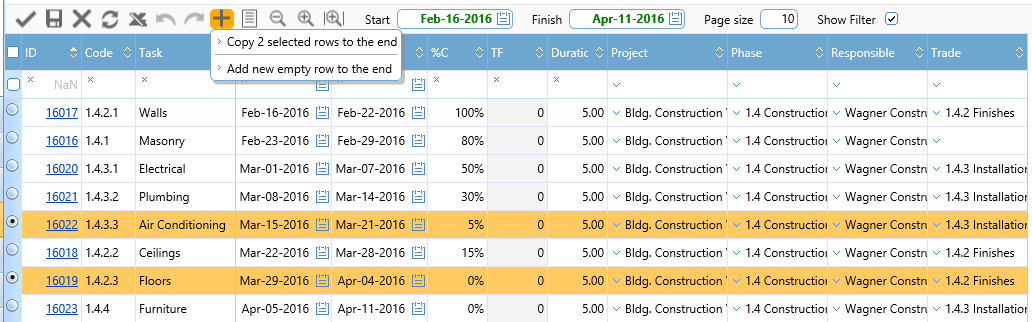
Clicking a button adds one or more task lines to the schedule. If no tasks are selected when this button is clicked a new task line is automatically created at the bottom of the task grid. If one or more tasks is selected when this button is clicked a dialog appears next to the button:
Select "Copy x selected rows to the end" or "Add new empty row to the end".
Important note: The Add Task button is not available if the Gantt chart is in Grouping mode. Clear all grouping to use the Add Task button.
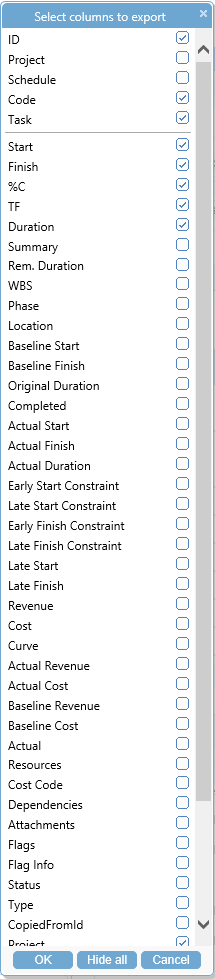
Clicking this button opens a field selector dialog. Place a check in the box next to each field you wish to display in the Gantt chart control. When you click the OK button the dialog closes and the Gantt chart control is updated with your selections. Settings made with the Show/Hide Columns button are saved with each schedule.
The time scale on the chart (right) side of the Gantt control can be adjusted using this button. For example, the time scale can be years and months or weeks and days. Clicking this button zooms out on the time scale. The settings for this button are saved by user and device.
To zoom to a specific time scale, right click on the Gantt chart and select from the context menu. See Interacting with the Gantt Chart.
The time scale on the chart (right) side of the Gantt control can be adjusted using this button. For example, the time scale can be years and months or weeks and days. Clicking this button zooms in on the time scale. The settings for this button are saved by user and device.
To zoom to a specific time scale, right click on the Gantt chart and select from the context menu. See Interacting with the Gantt Chart.
The time scale on the chart (right) side of the Gantt control can be adjusted using this button. For example, the time scale can be years and months or weeks and days. Clicking this button zooms in or out on the time scale to allow as many tasks as possible from the current task page to be displayed from start to finish. The settings for this button are saved by user and device.
To zoom to a specific time scale, right click on the Gantt chart and select from the context menu. See Interacting with the Gantt Chart.
Schedule Start can be manually edited or automatically calculated. If edited by a user the date is black. If calculated - from the Start date of the earliest task - it is green. If the Start field is edited by a user no task in the schedule will be allowed to take place before the selected date. If you have manually entered a Start date and then wish to have PMWeb calculate it, simply clear the Start field and save the Gantt chart.
Type a date in this field or click the date picker button and select one from the date picker dialog. The default is the day the schedule is created.
Schedule Finish can be manually edited or automatically calculated. If edited by a user the date is black. If calculated - from the Finish date of the latest task - it is green. If the Finish field is edited by a user no task in the schedule will be allowed to take place after the selected date. If you have manually entered a Finish date and then wish to have PMWeb calculate it, simply clear the Finish field and save the Gantt chart.
Type a date in this field or click the date picker button and select one from the date picker dialog. The default is the day the schedule is created.
This setting determines how many task lines to scroll when using the Page Navigator Control. See Schedules Gantt Chart for information about the Page Navigator Control. This setting is saved by user and device. The default is "10".
If this box is checked, filter fields are shown at the top of the columns in the table (left) side of the Gantt control. If unchecked, filter fields are hidden. This setting is saved by user and device.
Select one or more tasks and then click this button to open the Resources Dialog. Use the dialog to assign or unassign one or more resources to all of the selected tasks.
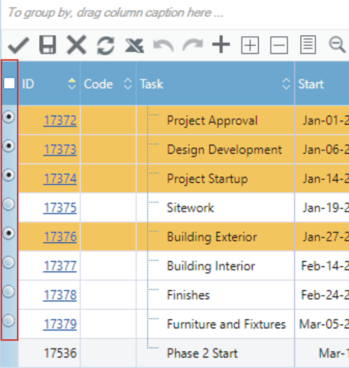
To select more than one task at a time, click and drag in the selection button column, the first column in the grid: