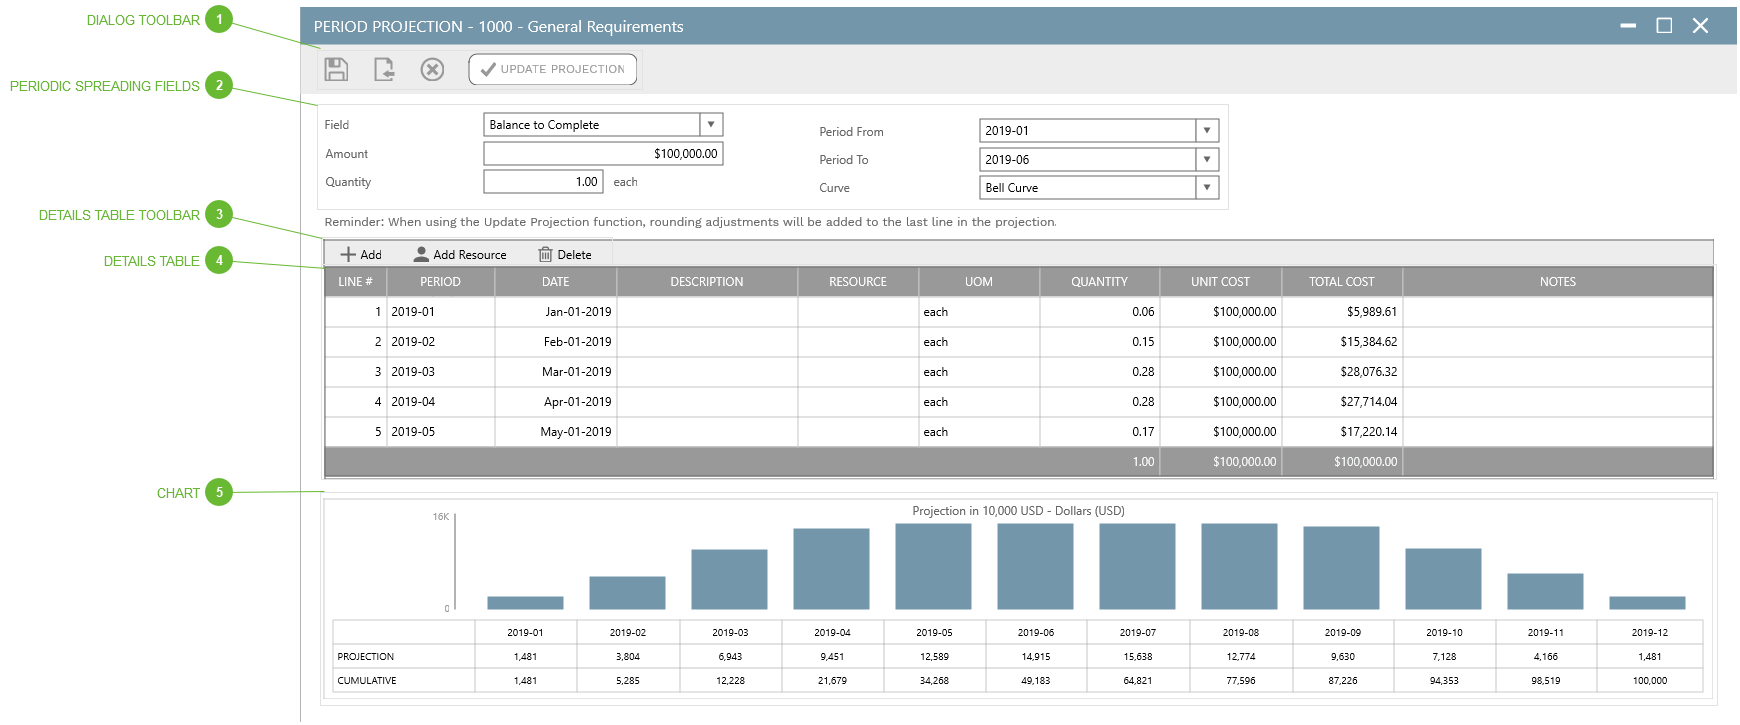
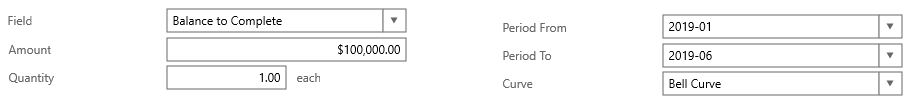
Field Dropdown - This is a system list. The choices are "Forecast to Complete" (the default) and "Balance to Complete". See Forecasts for information about forecasting methods. Note that this field is only visible if the dialog is opened from a forecast.
Amount Field - This prefills with the amount from the record line but may be edited.
Quantity Field - This prefills with the quantity from the record line but may be edited.
Period From Field - Select the first period in the spread range.
Period To Field - Select the last period in the spread range.
Curve Field - The selected curve determines how the spread is calculated.
Note that the Save button only needs to be used if you have directly edited the details table. Data is automatically saved when you click the Calculate button.
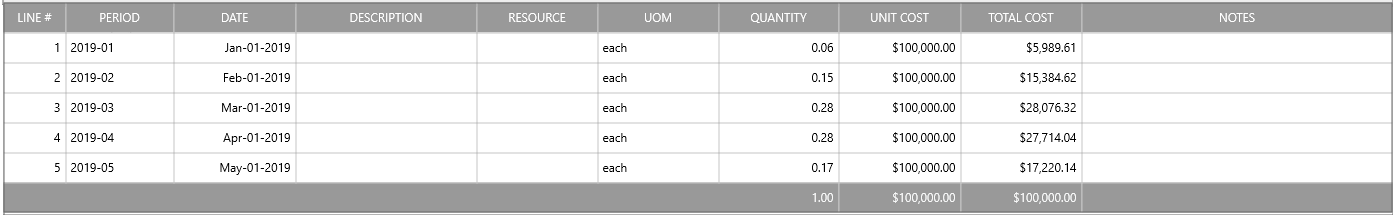
Quantity Field - Calculated as the Quantity field in the Periodic Spreading Fields prorated by the number of period lines and the number of days in the period on the line but may be edited.
Unit Cost Field - Prefilled as the Unit Cost field in the Periodic Spreading Fields but may be edited.
Total Cost Field - Calculated as the Amount field in the Periodic Spreading Fields prorated by the number of period lines and the number of days in the period on the line but may be edited.